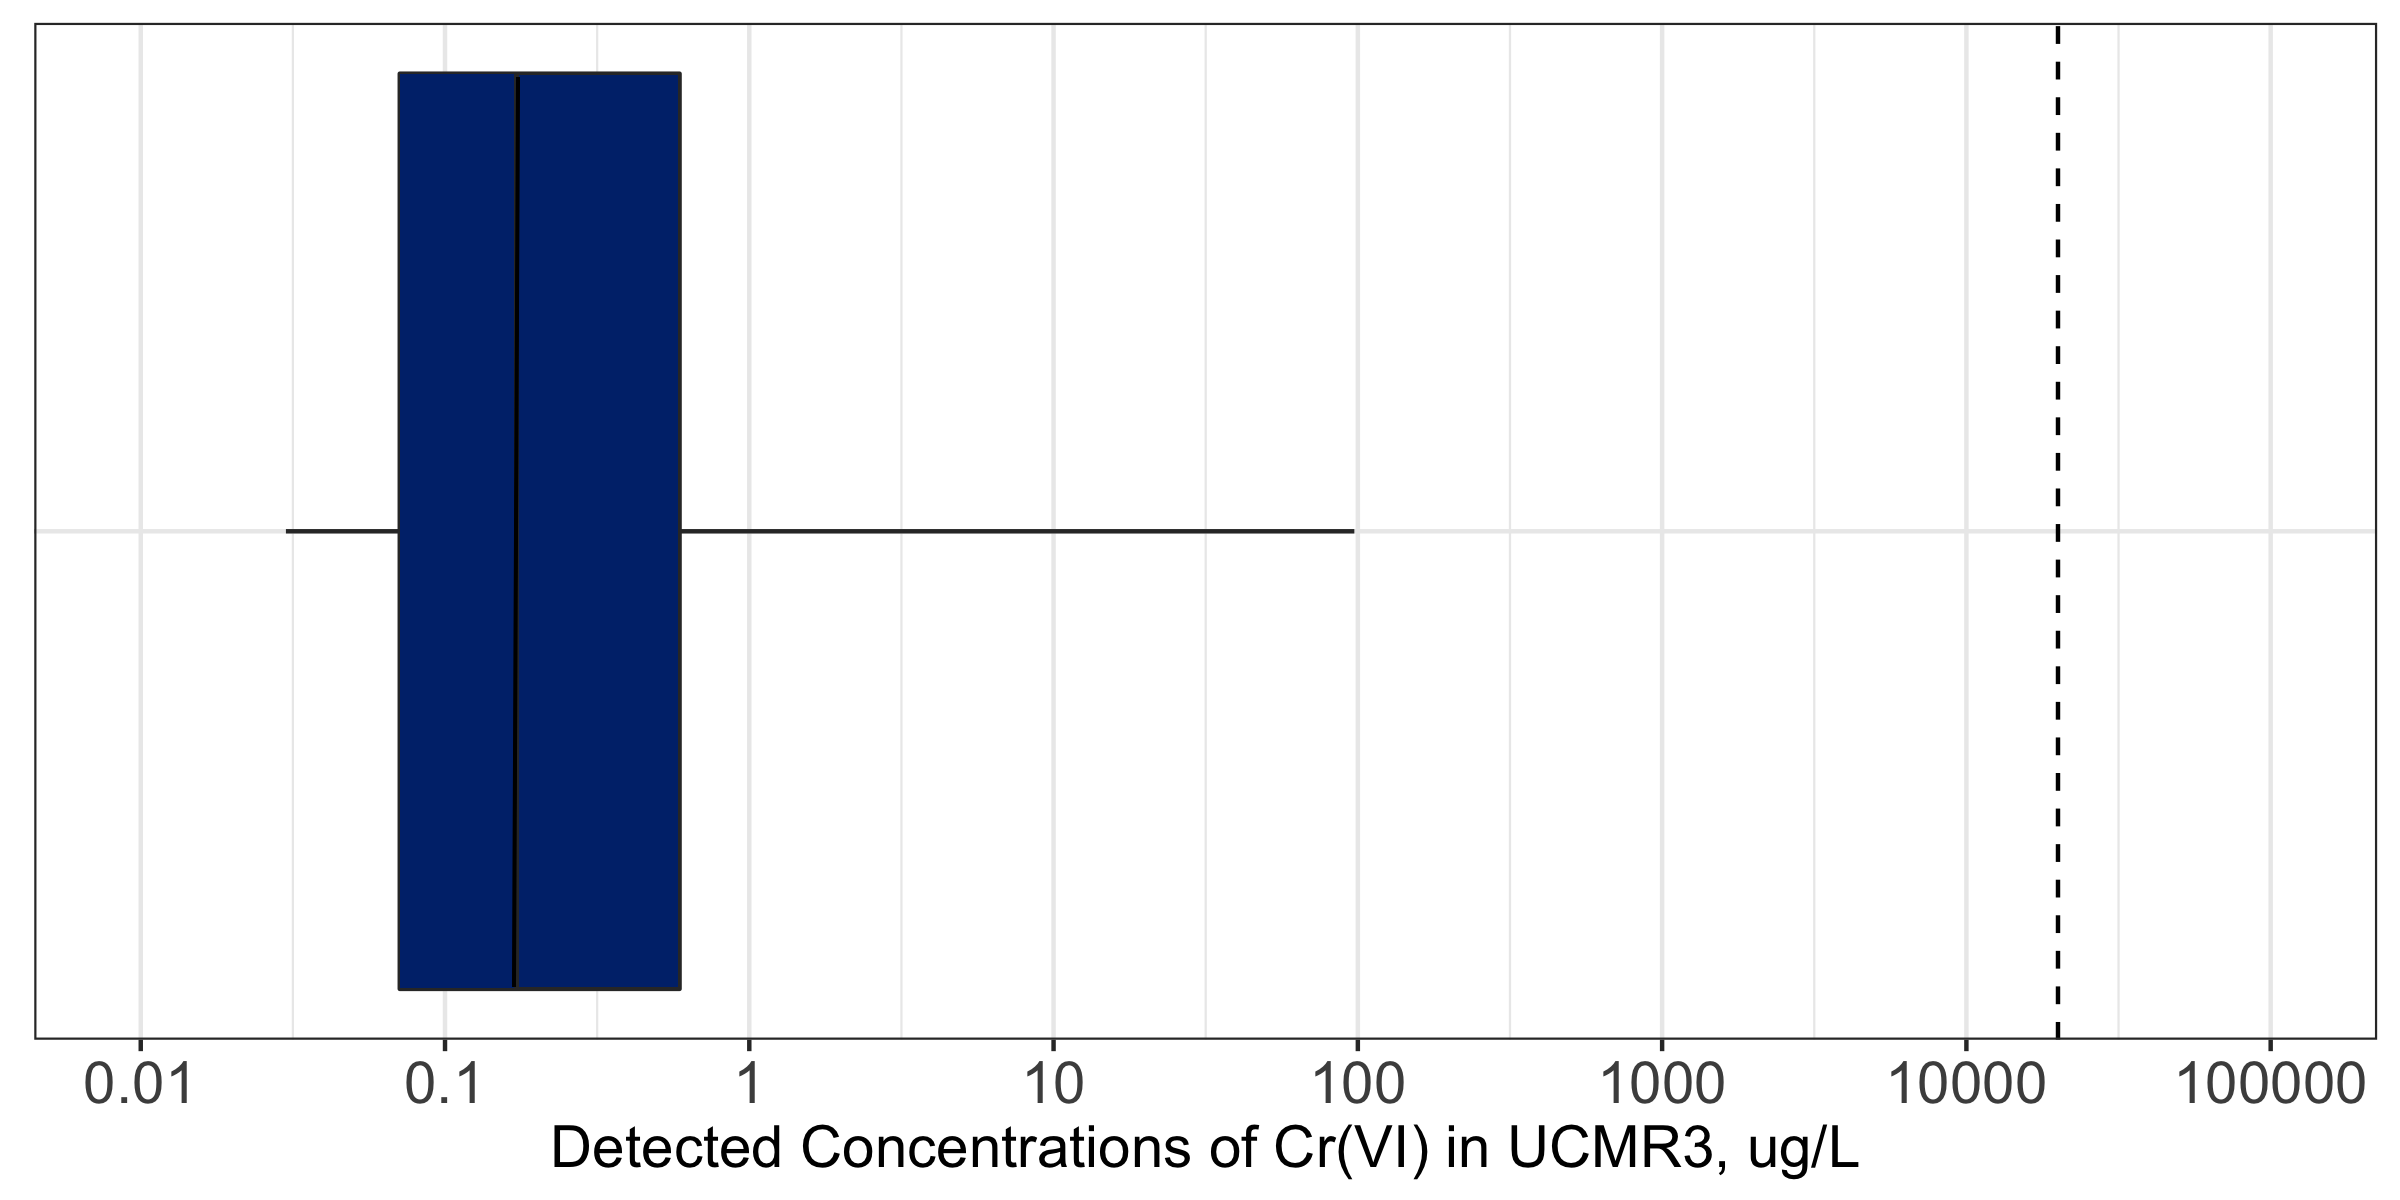
Figure 2. Detected concentrations of Cr(VI) in U.S. drinking water samples collected through December 2015 by the UCMR3 survey (μg/L). The whiskers represent minimum and maximum concentrations detected; the blue box represents 25 to 75 percentiles of detected values; the dark black line represents the median concentration detected. The dotted black line marks the lowest carcinogenic dose of Cr(VI) in the 2-yr NTP carcinogenicity study (based on comparisons to historical control data).