Chromium can be found in drinking water in both the trivalent and hexavalent forms as a result of natural (i.e. geologic) and man-made (i.e. anthropogenic) sources. The current U.S. EPA maximum contaminant level (MCL) for total chromium in drinking water is 100 ug/L. To understand the occurrence of hexavalent chromium [Cr(VI)] and other contaminants in U.S. drinking water that are currently not regulated under the Safe Drinking Water Act, the U.S. EPA is conducting a nationwide survey of public water systems (PWS) under the Third Unregulated Contaminant Monitoring Rule (UCMR3). Cr(VI) concentrations have been characterized in this survey using Method 218.7 with a minimum reporting level (MRL) of 0.03 ug/L.
Our analysis of the preliminary data for UCMR3 (USEPA 2017a, 2017b) shows that Cr(VI) detection in the U.S. drinking water supply is widespread, but occurs predominantly at low levels. Of the approximately 4900 PWS systems surveyed as of December 2015, 89% reported levels of Cr(VI) at or above the MRL. The average Cr(VI) concentration across all samples[1] (n=62,837) was 0.786 ug/L and reported concentrations ranged from the minimum reporting level of 0.03 ug/L to a maximum of 97.38 ug/L.
Figure 1 presents average Cr(VI) concentrations by state. State averages ranged from 0.06 ug/L (RI) to 6.31 ug/L (OK)
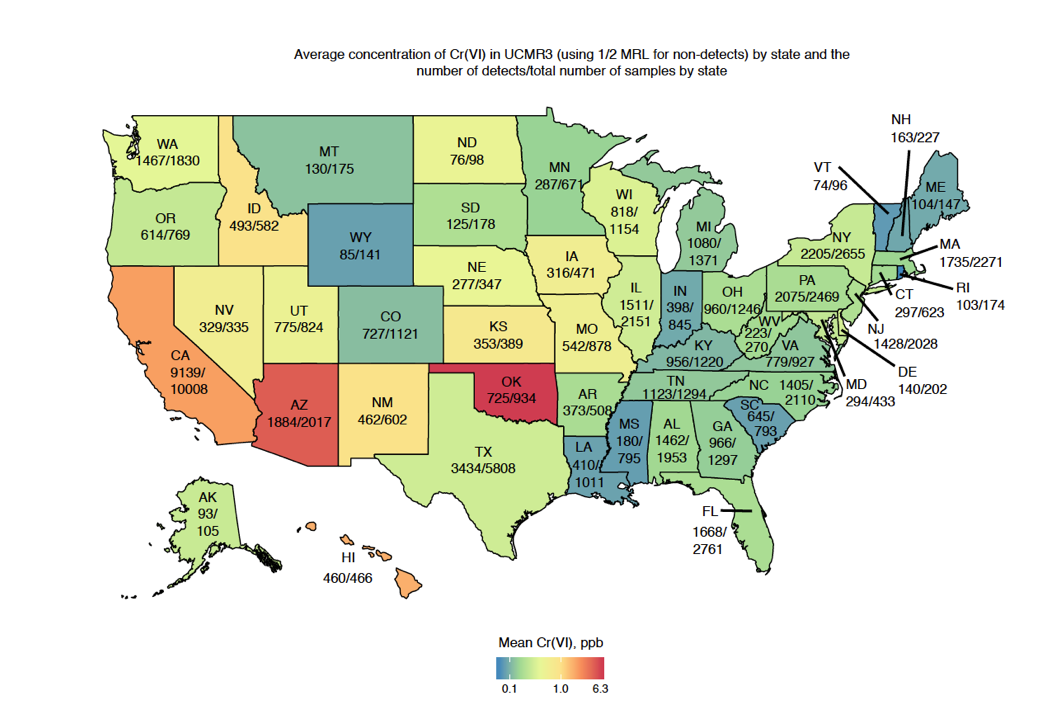
Figure 1. Map of average Cr(VI) concentrations in drinking water throughout the U.S. These values include non-detects as 1/2 the MRL of 0.03 μg/L. The total number of detects over the total number of samples collected in UCMR3 through December 2015 are also presented by state.
Background concentrations of Cr(VI) in U.S. drinking water are well below the Cr(VI) doses used in the NTP 2-yr animal carcinogenicity study (NTP 2008). Figure 2 compares the range of Cr(VI) detected in U.S. drinking water (USEPA 2015b) to the minimum Cr(VI) dose tested on male/female rats and mice that resulted in carcinogenicity (20,000 ug/L). The lowest observed carcinogenic Cr(VI) dose (based on historical control data) from the NTP study is approximately 20,000 times and 200 times greater than the average and maximum concentrations in U.S. drinking water, respectively.
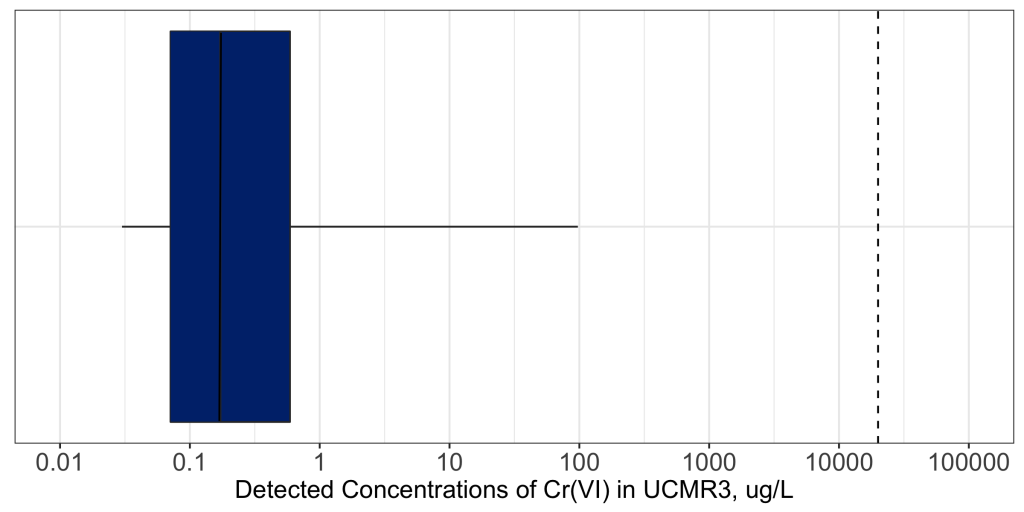
Figure 2. Detected concentrations of Cr(VI) in U.S. drinking water samples collected through December 2015 by the UCMR3 survey (μg/L). The whiskers represent minimum and maximum concentrations detected; the blue box represents 25 to 75 percentiles of detected values; the dark black line represents the median concentration detected. The dotted black line marks the lowest carcinogenic dose of Cr(VI) in the 2-yr NTP carcinogenicity study (based on comparisons to historical control data).
Finally, presented below in Table 1 is a summary of the UCMR3 results for individual states.
Table 1: Concentration (ug/L) of Cr(VI) reported in UCMR3 (January 2017) in States and Territories*
| State/Region | Samples | Detects | Avg Conc | Min | Max |
|---|---|---|---|---|---|
| Alaska | 105 | 93 | 0.26 | 0.015 | 1.5 |
| Alabama | 1953 | 1462 | 0.16 | 0.015 | 3.2 |
| Arkansas | 508 | 373 | 0.18 | 0.015 | 3.51 |
| American Samoa | 78 | 72 | 0.77 | 0.015 | 3 |
| Arizona | 2017 | 1884 | 4.52 | 0.015 | 79 |
| California | 10008 | 9139 | 2.10 | 0.015 | 47 |
| Colorado | 1121 | 727 | 0.12 | 0.015 | 1.3 |
| Connecticut | 614 | 504 | 0.17 | 0.015 | 1.2 |
| District of Columbia | 32 | 32 | 0.08 | 0.042 | 0.12 |
| Delaware | 202 | 140 | 0.31 | 0.015 | 4.7 |
| Florida | 2761 | 1668 | 0.18 | 0.015 | 2.6 |
| Georgia | 1297 | 966 | 0.14 | 0.015 | 2.8 |
| Guam | 225 | 225 | 1.79 | 0.052 | 26 |
| Hawaii | 466 | 460 | 1.73 | 0.015 | 9.7 |
| Iowa | 471 | 316 | 0.57 | 0.015 | 2.75 |
| Idaho | 582 | 493 | 0.94 | 0.015 | 7.9 |
| Illinois | 2151 | 1511 | 0.28 | 0.015 | 4.5 |
| Indiana | 845 | 398 | 0.09 | 0.015 | 3.2 |
| Kansas | 389 | 353 | 0.75 | 0.015 | 8 |
| Kentucky | 1220 | 956 | 0.11 | 0.015 | 1.5 |
| Louisiana | 1011 | 410 | 0.09 | 0.015 | 5.1 |
| Massachusetts | 2271 | 1735 | 0.15 | 0.015 | 20 |
| Maryland | 433 | 294 | 0.24 | 0.015 | 3.8 |
| Maine | 147 | 104 | 0.09 | 0.015 | 2.6 |
| Michigan | 1371 | 1080 | 0.13 | 0.015 | 1.535 |
| Minnesota | 671 | 287 | 0.15 | 0.015 | 7.89 |
| Missouri | 878 | 542 | 0.56 | 0.015 | 6.2 |
| Northern Mariana Islands | 46 | 46 | 1.02 | 0.15 | 7.2 |
| Mississippi | 795 | 180 | 0.08 | 0.015 | 2.579 |
| Montana | 175 | 130 | 0.12 | 0.015 | 1.25 |
| North Carolina | 2110 | 1405 | 0.15 | 0.015 | 11 |
| North Dakota | 98 | 76 | 0.45 | 0.015 | 1.6 |
| Nebraska | 347 | 277 | 0.43 | 0.015 | 3.9 |
| New Hampshire | 227 | 163 | 0.09 | 0.015 | 0.46 |
| New Jersey | 2028 | 1428 | 0.19 | 0.015 | 3.8 |
| New Mexico | 602 | 462 | 0.95 | 0.015 | 10.63 |
| Nevada | 335 | 329 | 0.61 | 0.015 | 12 |
| New York | 2655 | 2205 | 0.26 | 0.015 | 7.3 |
| Ohio | 1246 | 960 | 0.18 | 0.015 | 3.2 |
| Oklahoma | 934 | 725 | 6.31 | 0.015 | 97.38 |
| Oregon | 769 | 614 | 0.25 | 0.015 | 2.2 |
| Pennsylvania | 2469 | 2075 | 0.18 | 0.015 | 11.587 |
| Puerto Rico | 667 | 542 | 0.82 | 0.015 | 26.251 |
| Rhode Island | 174 | 103 | 0.06 | 0.015 | 0.26 |
| South Carolina | 793 | 645 | 0.08 | 0.015 | 0.64 |
| South Dakota | 178 | 125 | 0.19 | 0.015 | 1 |
| Tennessee | 1294 | 1123 | 0.13 | 0.015 | 1.5 |
| Texas | 5808 | 3434 | 0.28 | 0.015 | 10.3 |
| Utah | 824 | 775 | 0.48 | 0.015 | 5.242 |
| Virginia | 927 | 779 | 0.13 | 0.015 | 1.2 |
| Virgin Islands | 18 | 11 | 0.27 | 0.015 | 1 |
| Vermont | 96 | 74 | 0.08 | 0.015 | 0.39 |
| Washington | 1830 | 1467 | 0.38 | 0.015 | 9.9 |
| Wisconsin | 1154 | 818 | 0.33 | 0.015 | 3.3 |
| West Virginia | 270 | 223 | 0.17 | 0.015 | 2.4 |
| Wyoming | 141 | 85 | 0.08 | 0.015 | 0.51 |
| United States | 62837 | 47503 | 0.79 | 0.015 | 97.38 |
References:
National Toxicology Program (NTP) (2008). Research Triangle Park, NC: National Toxicology Program; Toxicology and Carcinogenesis Studies of Sodium Dichromate Dihydrate (CAS No 7789-12-0) in F344/N Rats and B6C3F1 Mice (Drinking Water Studies). TR 546. [PubMed]
USEPA (2017a). The Third Unregulated Contaminant Monitoring Rule (UCMR3): Data Summary. Last updated January 2017. https://www.epa.gov/sites/production/files/2017-02/documents/ucmr3-data-summary-january-2017.pdf
USEPA (2017b). The Third Unregulated Contaminant Monitoring Rule (UCMR3): Occurrence Data. Last updated January 2017. https://www.epa.gov/dwucmr/occurrence-data-unregulated-contaminant-monitoring-rule [1] The average was calculated using ½ the MRL of 0.03 ug/L for non-detects.